
Project Overview
Viseca Card Services SA was planning an upcoming relaunch of their main website and sought to better understand current user behavior and traffic patterns. To guide future research efforts, a comprehensive quantitative analysis using Google Analytics 4 and Hotjar was conducted.
The insights gathered served as a foundation for further qualitative research and stakeholder management at Viseca, helping to rationalize and prioritize future projects.

The Challenge
• Their switch to GA4 was recent, and only data from past 6 months (April ’23–September ’23) was available.
• As this was their first approach to a quantitative analysis, no past set up reports or segments were available.
• To gather enough coherent information to generate proto-personas that characterize user behavior.

The Goal
To create an understanding of current page traffic and user flows on viseca.ch, with the goal to answer following questions using Google Analytics and Hotjar:
1. Which pages see the most traffic?
2. What are the main interests of website visitors?
3. What are the main search intents on the website?
4. What proto-personas can be linked to the data?
2. What are the main interests of website visitors?
3. What are the main search intents on the website?
4. What proto-personas can be linked to the data?

Impact
The analysis provided the team with new insights into user behavior and intentions on their website, which were further clarified through the creation of two proto-personas:

Each proto-persona represents distinct behaviors, goals, and needs, marking the first step for Viseca to characterize specific user engagement on viseca.com. These personas helped validate first internal assumptions and facilitate data-driven decisions.
This led to a better understanding of user flows, prioritization of website features, and a user-centric approach and played a crucial role in Viseca’s board meetings, enhancing data-driven discussions and decision-making.

Process & Methodology
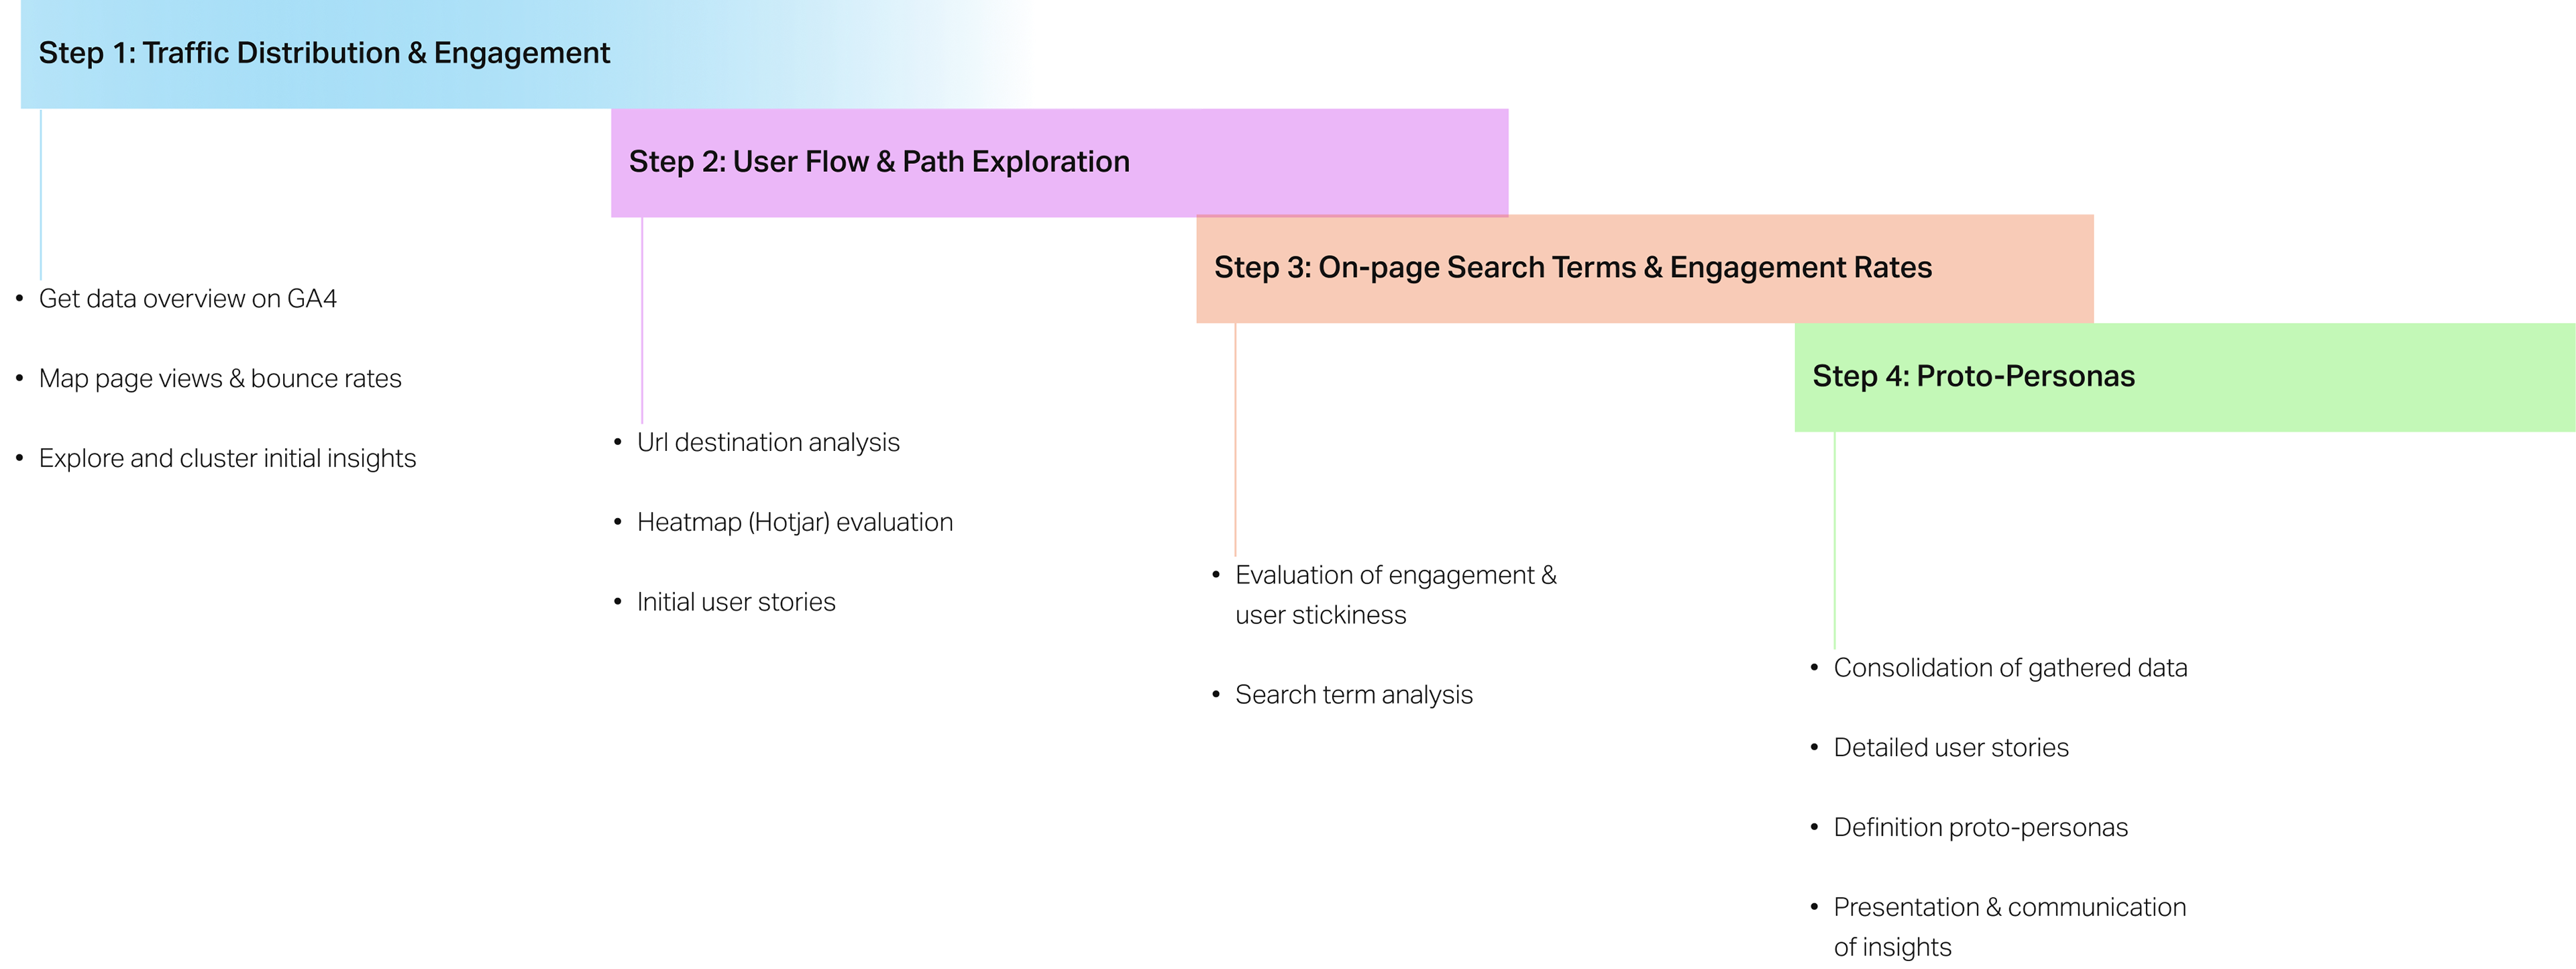
Since this was the first quantitative analysis conducted for Viseca, there was no preliminary information on what data was tracked or what to expect. I divided my process into four steps to gradually build a comprehensive understanding of user engagement while also exploring new data points.
Here’s a very high-level overview of what my process looked like.
Here’s a very high-level overview of what my process looked like.
To better understand and visualize the approach, all information was gathered on a Miro board for stakeholders.
Furthermore, all data reflect user interactions between April and September 2023.
Let's dig in.

Step 1: Traffic Distribution & Engagement
Since I didn’t have any previously done reports by Viseca or insights on what information was available to me in GA4, apart from the standard setup, I had to start from scratch to get an overview of traffic distribution and engagement first.
The goal was to have a starting point for user flow and path exploration in the next step.
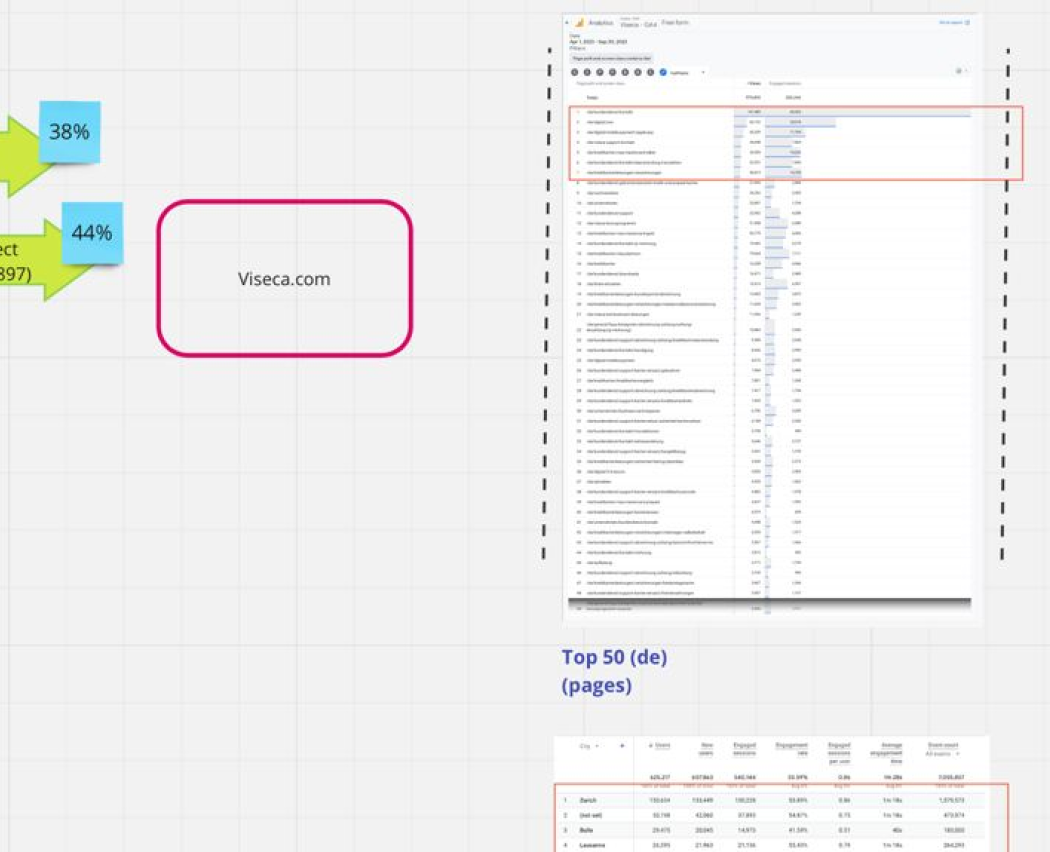
User engagement and all insights were mapped on Miro
Key insights
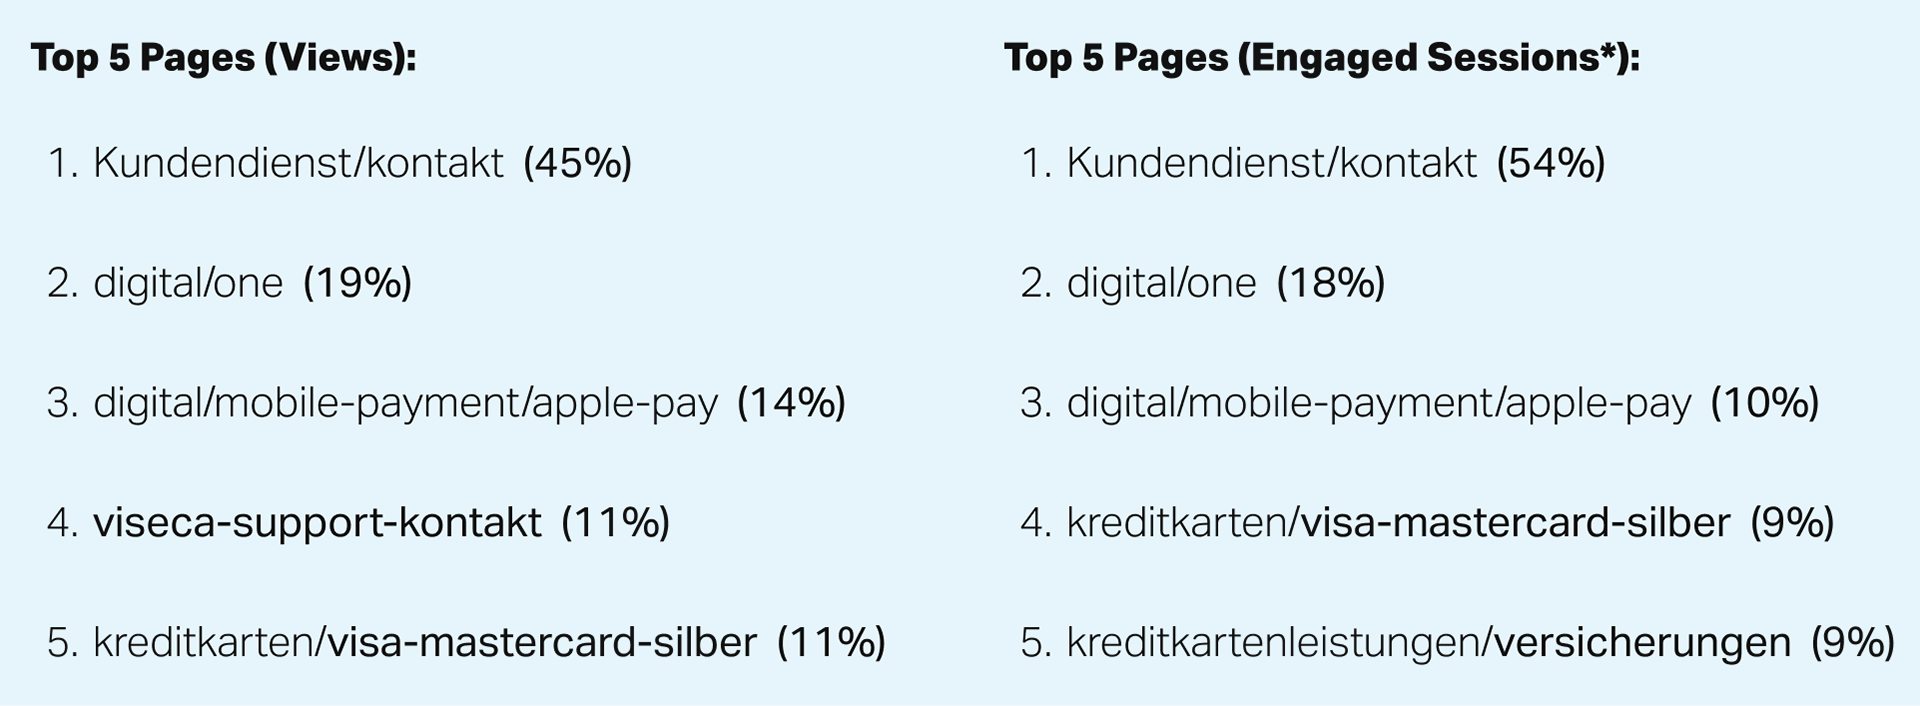
*A session lasting longer than 10 seconds, involving a conversion event or having at least 2 page views/screen views.
...When looking at averaged page views versus bounce rates, six pages were identified with significantly higher bounce rates compared to the rest of the site...
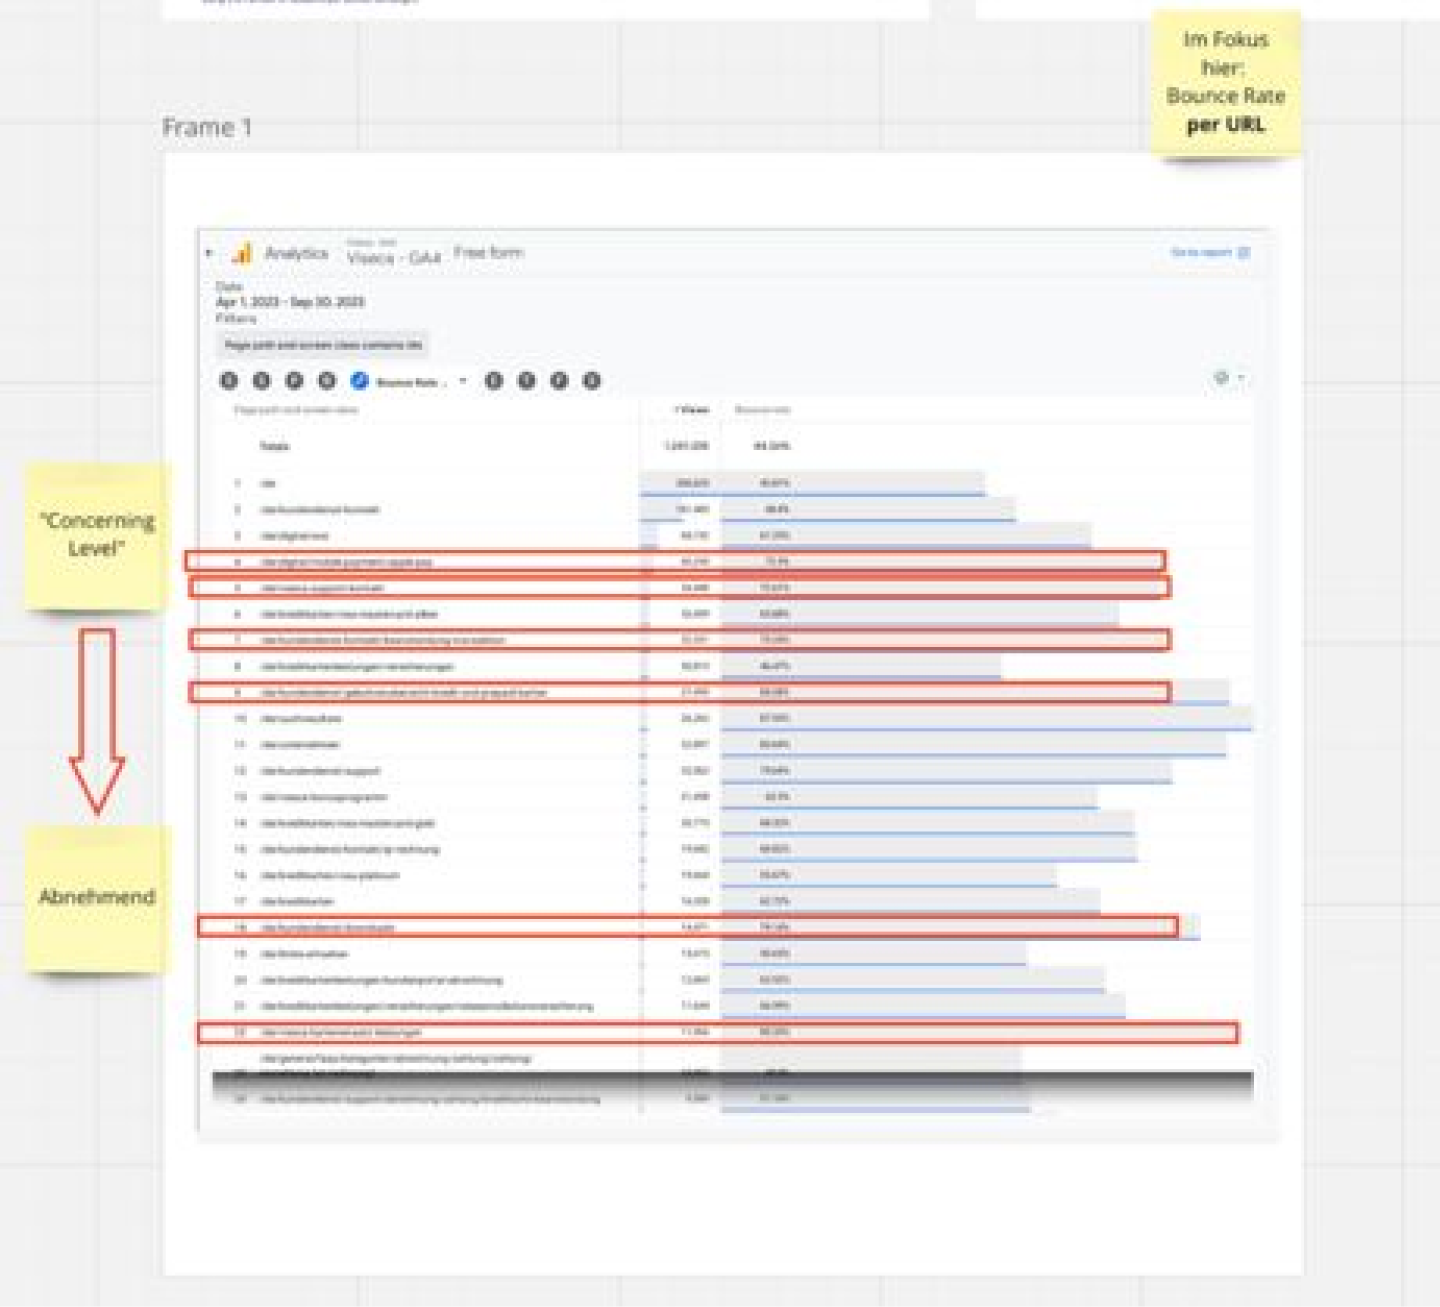
Key insight bounce rates
The "mobile-payment/apple-pay" page is one of the top 4 most viewed pages and showed an average 30% higher bounce rate on mobile than on desktop, indicating a missed user intention since the website is only informational and does not serve as a login or direct gateway for payment.
This broad overview indicated that the primary reason users visit viseca.com is customer service and support, followed by their member platform, Digital One. Relatively high engagement rates with Apple Pay and card insurance information provided further hints on primary user intentions on the site.

Step 2: User Flow & Path Exploration
In the path exploration, I consolidated the average site destinations per user originating from a defined landing page to better understand visitor intents.
As a starting point, I chose viseca.ch/de for private and business customers (both mobile and desktop).
...Viseca offers its users a dedicated entry point for business clients and private customers in the navigation, making it interesting to see how these two target groups differentiate from each other...
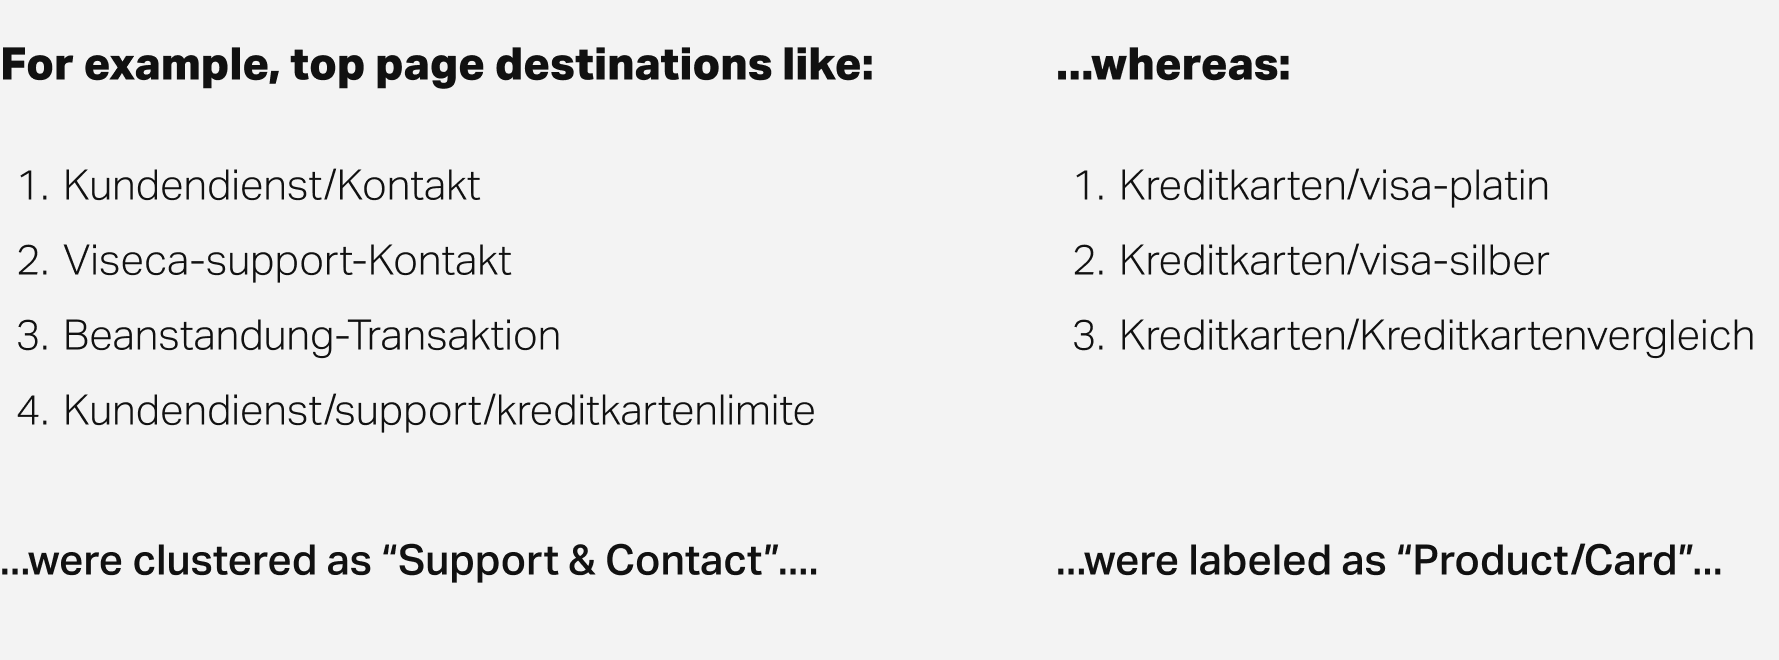
In a second step, I clustered destinations into three overarching categories, reflecting the nature of the pages:
1. Support & Contact, 2. Service/Informational, and 3. Product/Card...
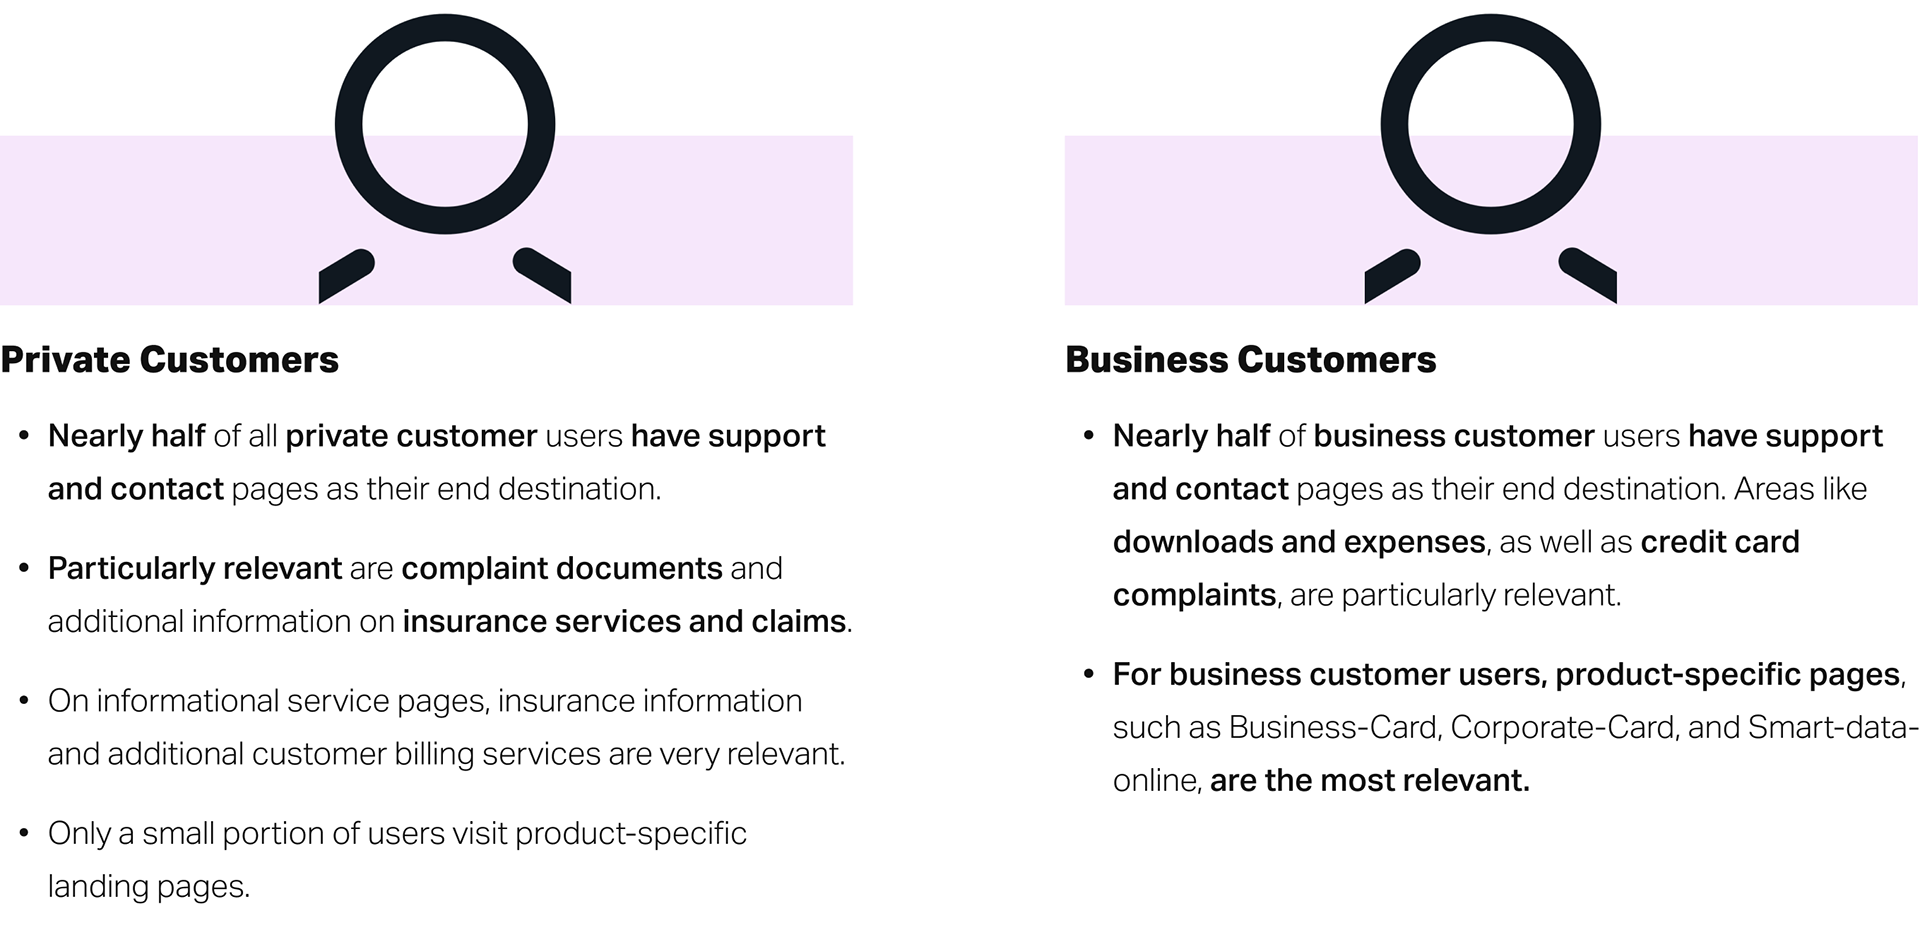
Clustering Outcome
....To further gain insight into user intentions, I utilized Hotjar to see where users clicked the most on the respective most visited pages per cluster.
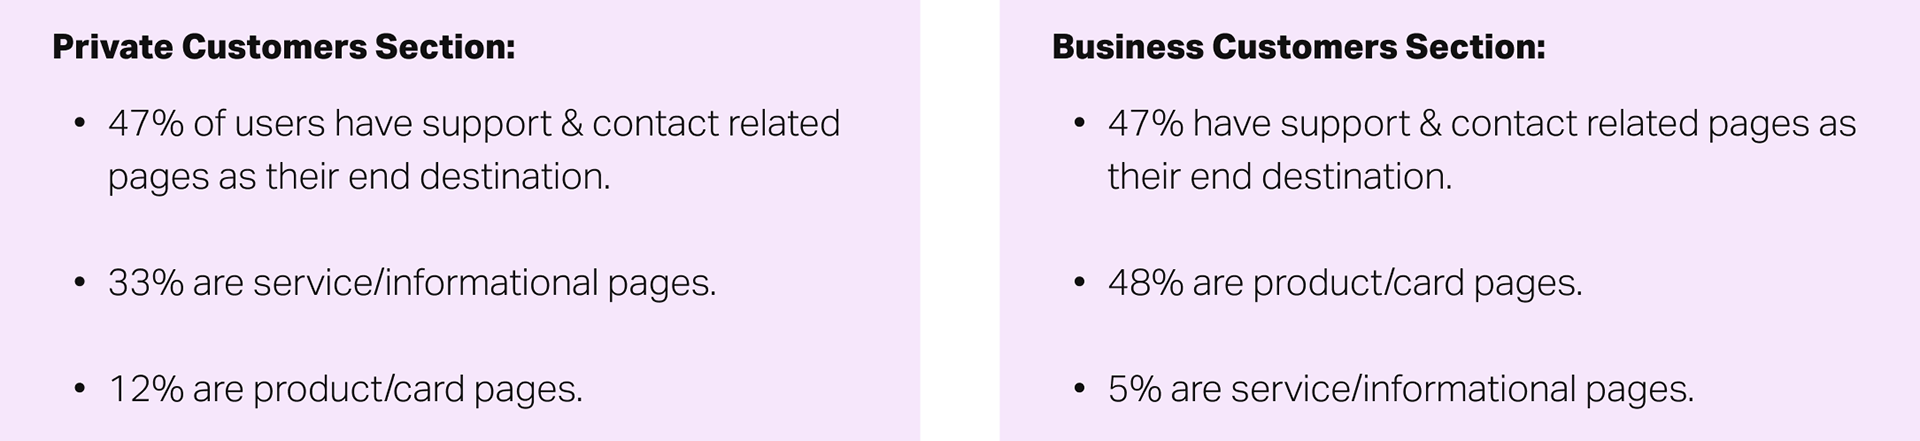
Percentage of users (Private & Business) within clustered destination
....For each cluster, I examined the heatmap of top visited pages to understand where users clicked.
This resulted in a list of final clicks on target pages in respective categories, such as for private customers on service/informational pages.
An example extract:
Target URL: Kreditkartenleistung/Versicherung Top Clicks
• Kreditkarte Silber, Gold, Platin
• Reiseannullationsversicherung
• Mietwagen-Selbstbehaltversicherung
• Reiseunterbruchversicherung
• Reiseannullationsversicherung
• Mietwagen-Selbstbehaltversicherung
• Reiseunterbruchversicherung
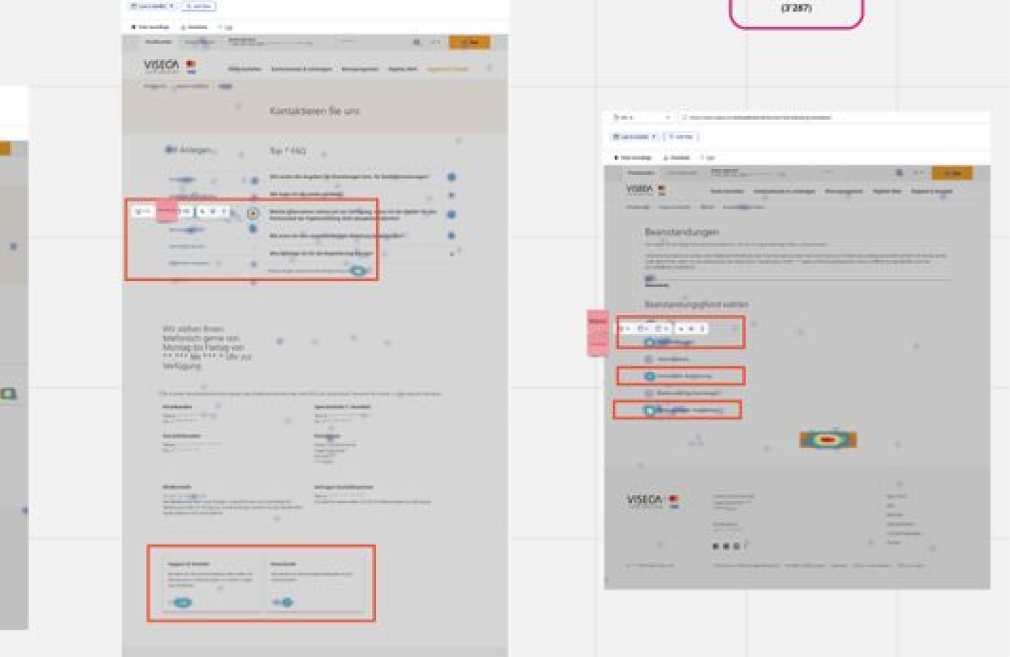
Extract of the Hotjar analysis mapped on Miro
Key insights phase 2
From the so far gathered information, the following key assumptions could be made:

Step 3: On-page Search Terms & Engagement Rates
In the third step, I analyzed on-page search terms and the average monthly, weekly, and daily stickiness rates.
This provided insights into how frequently returning users visited Viseca and which pages they accessed.
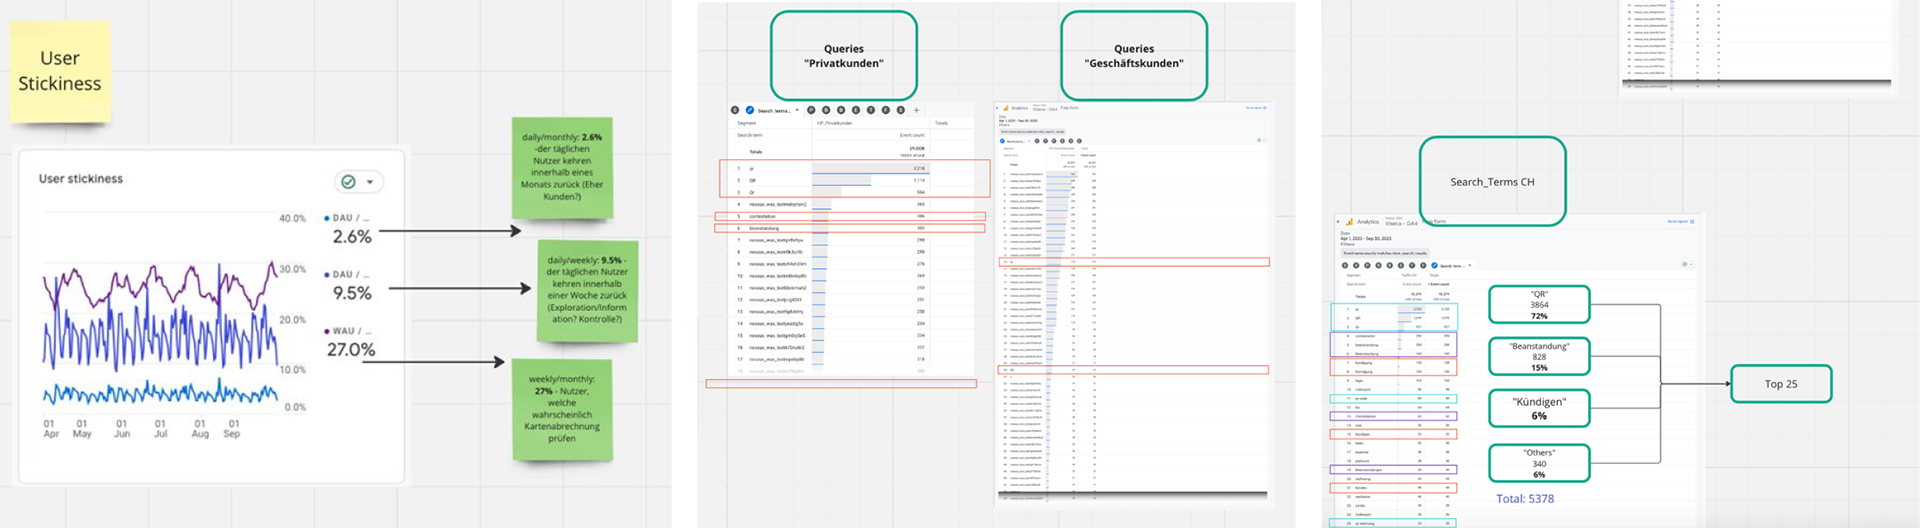
User stickiness and search queries mapped on Miro
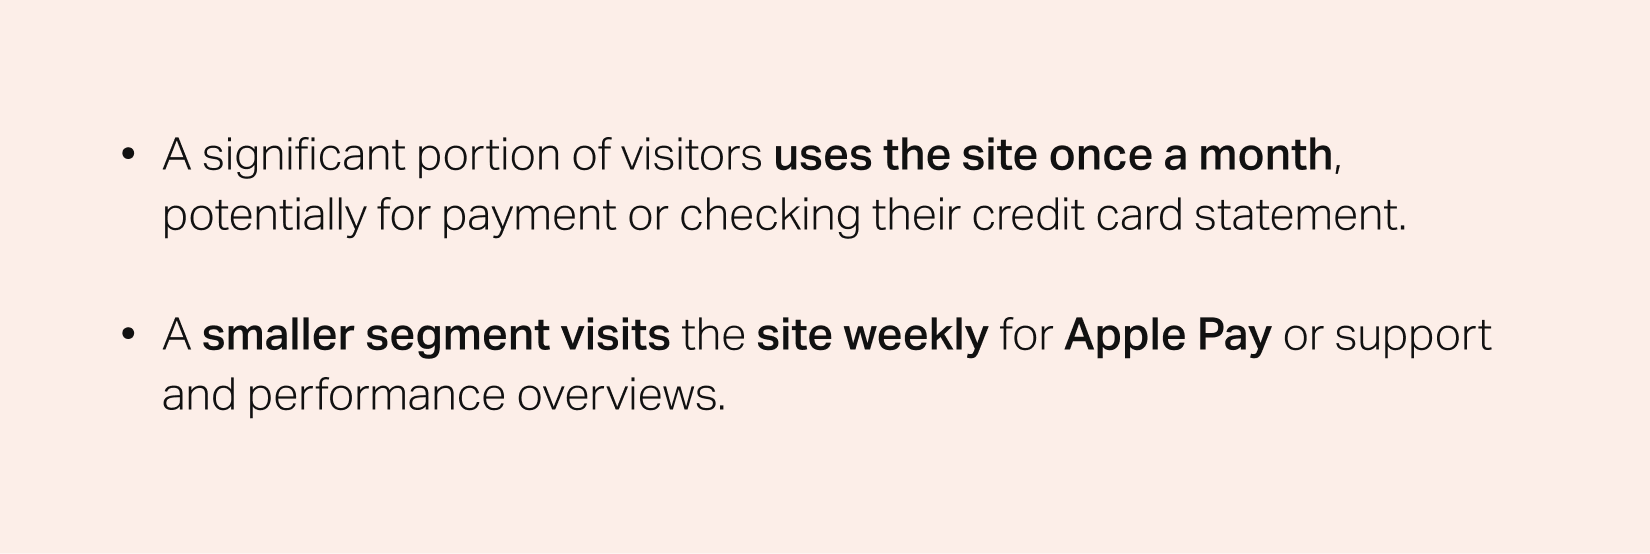
1. Engagement Rates
I found that:
27% of users visit viseca.ch monthly (most in the end and beginning of the month):
• busisness-card/expense
9.5% of users visit viseca.ch weekly:
• digital/mobile-payment/apple-pay
• viseca-karteneinsatz-leistungen
2.6% of users visit viseca.ch daily:
• Karteneinsatz & Leistungen
2. On-page Search Terms
A clustering of all search terms revealed that
72% of all search terms were “QR” related, indicating the
possible intention to either generate or order a QR code. Followed by “Beanstandung” (15%).
Key insights

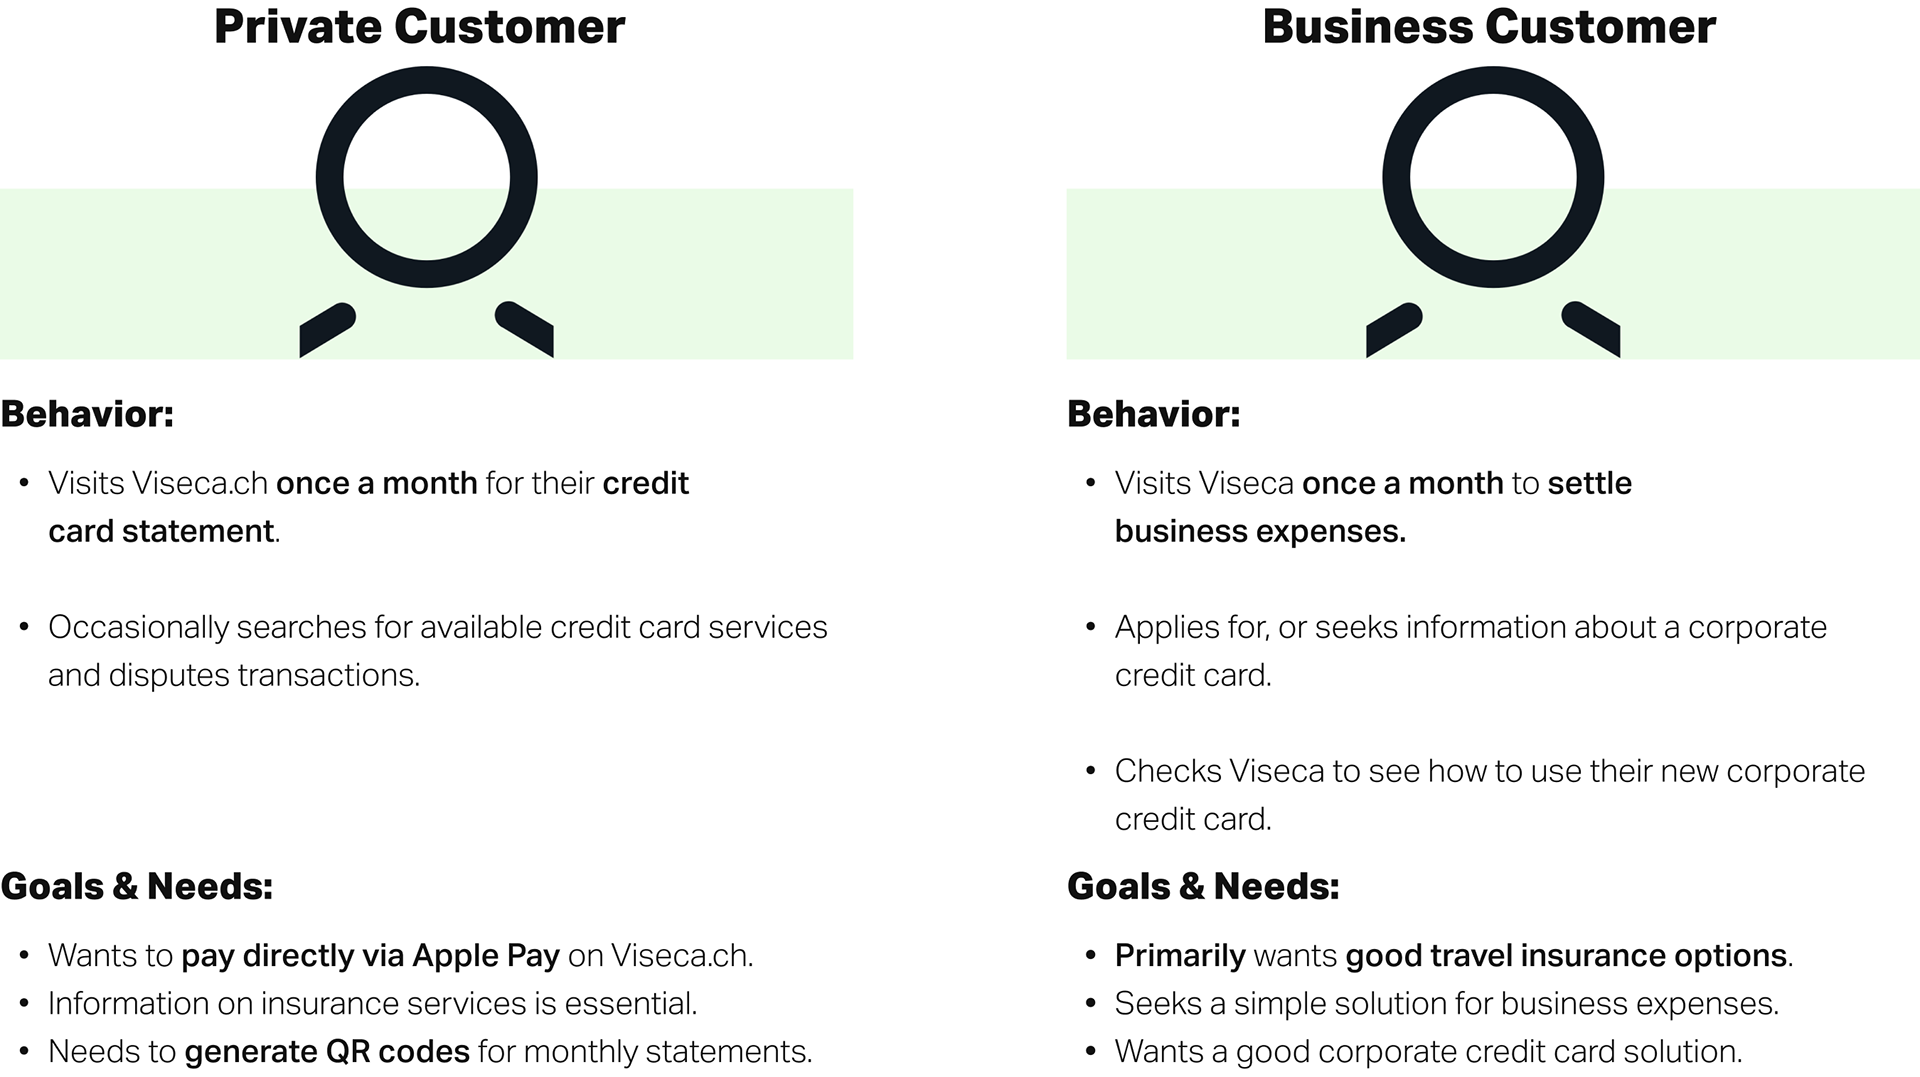
Step 4: Proto-Personas
As a final step, I gathered enough data to make initial assumptions about possible proto-personas. These proto-personas represent a first step in understanding user intentions and combine all the insights gained on user traffic on viseca.ch.
A next step would be to validate the proto-personas and generated insights through further qualitative studies or surveys, which wasn't within scope for this project.
Finally two main proto-personas were defined:

Result
The insights from the quantitative analysis were presented to the Viseca team and confirmed many of their existing assumptions. The personas helped validate initial internal assumptions and facilitated data-driven decision-making for the upcoming relaunch.
However, these proto-personas need to be further validated by Viseca in future research to ensure that the current assumptions accurately reflect the general target user base and their interaction with Viseca's services.
